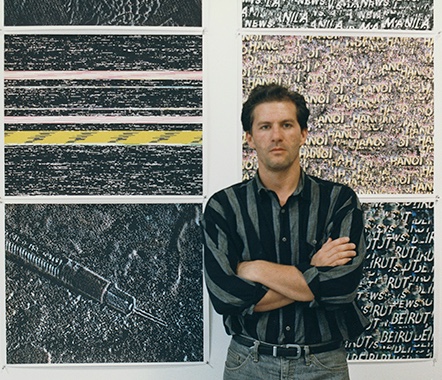
Artist and distinguished professor George Legrady at Media Arts and Technology (MAT), UC Santa Barbara, started working with digital imaging system seven years before Nikon came out with the first digital camera.
Legardy is known for a number of digital media projects such as Making Visible the Invisible: What the Community is Reading (2005) for the Seattle Public Library; Pockets Full of Memories (2001) commissioned by the Centre Pompidou, Paris; and Anecdoted Archive from the Cold War (1993) that won the National Endowment for the Arts award.
impactmania and Art, Design & Architecture Museum/impactmania intern Tess Reinhardt, visited professor George Legrady and one of MAT’s PhD students, Weidi Zhang.
BY PAKSY PLACKIS-CHENG
Digital imaging was originally developed for scientific and military missions in the ‘60s. In the mid-80s, you were already working with data in your work of arts. What spurred that?
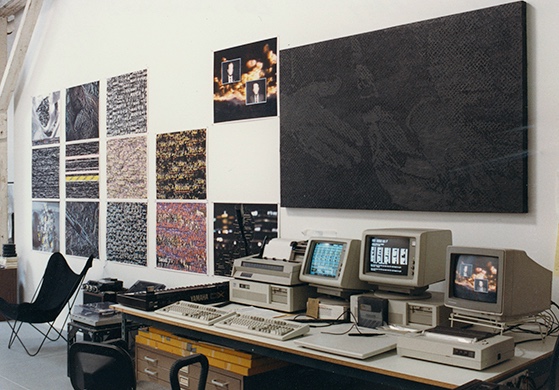
In 1985, I got my hands on a digital imaging system that could capture an image from video and turn it into a pixel image. This is about seven years before digital cameras, Photoshop, or anything like that. I realized that the image could be broken down into these discrete units—pixels. That led to the realization that the image was made up of elements: data.
I connected this analog to digital device and the only signal I could get was video with noise—similar to TV-noise.
I started to do some research about noise and came across Claude Shannon a scientist at Bell Labs, who in 1948, came up with the Information theory. Information technology deals with the transmission, processing, extraction, and utilization of information.
How did you go from that to working with cultural data?
The actual cultural data kicked in in 1992. All of a sudden, you could scan documents and capture sound and moving image through QuickTime.
The evolution as a digital media artist had a lot to do with carrying on conversations with what the available technologies made possible. I just gave a talk at a conference on affordance. Affordance is a topic of discussion in certain areas of the culture. For example, this coffee cup here with the ear on the side of the cup affords you to pick up the cup easily. In some sense, my work evolved in conversation with what became available in terms of digital technologies.
How do you create a story out of so much data?
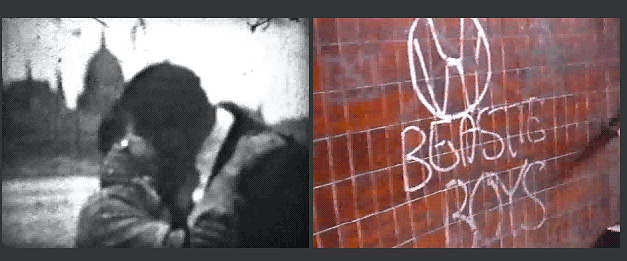
My first interactive database work was a commission for an exhibition on the Cold War. My families were political refugees from Hungary. I was interested in what kind of a history I could put together with a set of disparate objects, images, and sounds that I had at hand. It is a challenge to create a story out of all of this.
I used the floor plan of eight rooms of the former “Workers’ Movement” museum in Budapest, the official propaganda museum of the Communist Party. Items, in the form of over sixty stories, had been arranged thematically in the rooms. That involved a certain amount of what’s called clustering. I had to organize the odds and ends into groups that could fit together. Then I had to come up with a way by which the viewer could navigate the space. The goal was to create a work where each viewer would walk away with a slightly different story based on where he or she started and where he or she ended.
This work was very subjective and autobiographical. I wanted to come up with a system that would be more defined by the viewer.
Eventually, one of the most important works would be Pockets Full of Memories. I was commissioned by the Centre Pompidou in Paris to explore the archive memory and the public direction. I worked with a European team: a cognitive science team from Helsinki, Finland; designers from Stuttgart, Germany; and a production from Budapest, Hungary. The idea was that all the decision-making would be passed on to the system. Instead of me hard-wiring or deciding what rooms to put what information in, it would be based on the public. The public contributed an image of an object and then describing the object through a questionnaire. The semantic information would define how these objects are related to each other.
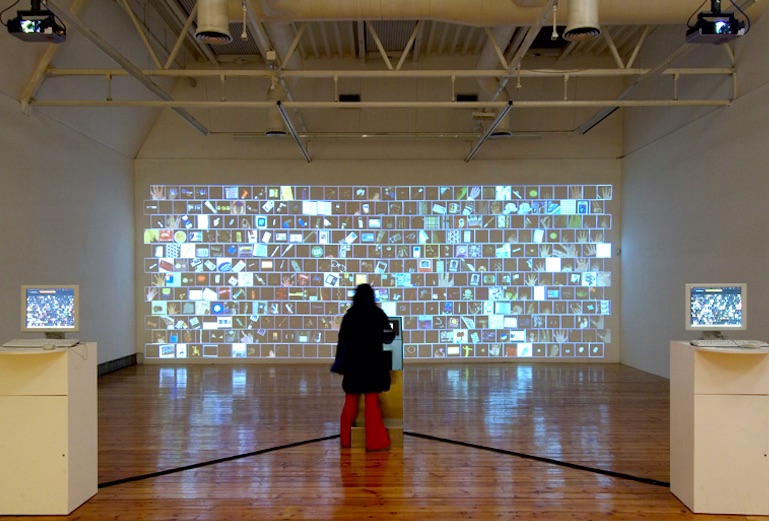
There is a place where you put in the object to take an image. The image would go on the screen, and all of the objects would re-organize, it’s called an artificial neural network algorithm.
What were the criteria for the order?
The public would put an object in the box, digitize it, and answer a questionnaire. One of the questionnaires was this slider set using the Osgood’s Semantic Differential. The object could be described by where it is situated between two polar adjectives such as ‘useful’ versus ‘useless’.
For example, a woman brought an ultrasound of an unborn child. Then, somehow kids figured out a way to put their heads in the box.
The exhibition started out in the Centre Pompidou, Paris then to Dutch Electronic Arts Festival (DEAF) in Rotterdam; Helsinki; Corner House in Manchester, UK; and Museum of Contemporary Arts (MOCA) Taipei in 2007.
Its cultural data—the object’s description, origin, and keywords—would be translated into numbers by computers. The semantic data determined where an object would fall. That would go back into the archive.
The public’s data would define how the set of objects would relate to each other. So every object in this grid, every object’s distance, every other object is based on those values. Then the system would re-calculate every two minutes and would create an order. Anytime a new object would come in, it would disrupt the order. Then we compare all the data from the different exhibitions.
Toys were the most important objects in Paris, there were a lot of people testing the system and caused blank screens in Helsinki. In Taipei, Taiwan, cell phones were the most common objects.
Making Visible the Invisible: What the Community is Reading for the Seattle Public Library is one of the longest running data visualization projects. It started in 2005 and it’s planned to go until 2019. The work gets all the library checkouts by the hour: books, movies, etc. The software collects the data, analyzes the data, and changes the data.
My student who designed the engineering for Making Visible the Invisible… is now a senior engineer at NVIDIA. The reason why I teach in this program is because I do a lot of projects with my students on the engineering side.
What are you doing with all the data?
The artwork only shows the data of the last hour. The titles stream by. They start big and they go small, it’s kind of poetic. A lot of this was designed based on my conversations with the librarians. But yes, we do collect all the data. We have 90 million checkouts. Every winter I teach a database class where we use that data. How many books were checked out in the last hour? How many DVDs?
What input did you use from the library?
The need for privacy—the library takes the data and remove all of the personal information. They create a file that they send to the server at the library. Our system then goes to that server and collects the data.
I have three-four computers. One of them parses the data, one creates the animation, and another one synchronizes the data. They are all connected to TV screens visible to the public.
I do a keyword frequency analysis. The words are color-coded based on their statistical usage. If there are three books checked out in cooking, 12 in religion, and 14 times in political history—each of those categories has a color. And so we mix the colors to create each word’s color.
Give me an example of what some of your students are working on now.
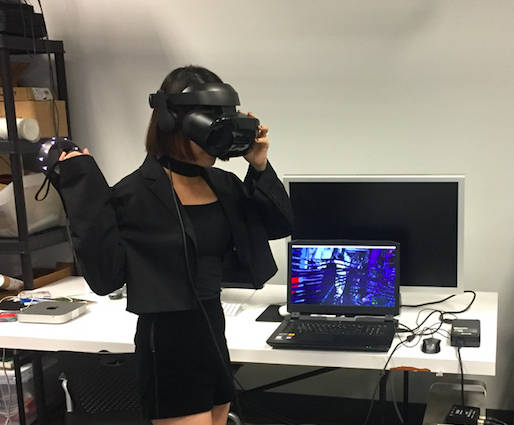
Weidi Zhang is using data coming in from the 250 computers at the Centre Pompidou to create a 3D environment. And ask questions such as What are museum visitors looking at?
The job of the person doing the visualization is to turn data into an image, then to create a way for people to interact with that image. Weidi’s project leans towards the fine arts. Some people lean all the way to the functional. Ideally, it should be somewhere in the middle.
We teach ‘How to Ask an Interesting Question’ from the database. By week three, students have to present actual work. Then we have three weeks to do a 3D interactive project.
What is one of the most challenging things to teach a student? What do they have trouble grasping?
Here’s the problem, you need three levels of expertise. You need to know how to ask an interesting cultural question. The people trained in social sciences are good at that. You need to know how to do the computational work, come up with the programming, that work suits the engineers. Then you need to know how to work well with original language—the artists are good at that.
There are usually 12 to 15 people in the class and so every person will have skills in one domain and be short in some of the other domains. Part of the logic of the class is that students inform, help, and influence each other.
We always ask our interviewees who’s left an imprint on their DNA. Your work has been exhibited all over the world and there are many people who you have worked with along the way. Could you name a few people who have affected how you work?
The person who introduced me to computing is Harold Cohen. He was a British painter and passed away a couple years ago.
Harold was trying to understand how he was making decisions as a painter. He translated this into a self-work called AARON—basically artificial intelligence.
The idea is that you first have to define a set of rules by which the software proceeds. Eventually, your software reaches a higher level, which may be similar to machine learning, where it becomes unsupervised learning. It starts filling in the gaps.
I met Harold at a party in 1981. The Monday after he gave me a key to his studio. All of a sudden, I had access to a minicomputer, a DEC PDP-11. Nobody had access to these things unless they were in specialized engineering or military research.
What did you do with it? Did you even know how to use it?
I learned programming. My first project was based on an article in Scientific American on how time doesn’t go backward. The demonstration was with a bottle of perfume that opened and the molecules leave and disperse.
Harold was really, really important for my work.
Did he say anything that stayed with you?
Harold Cohen never asked me of anything. When I asked him, “How come you gave me access to your studio and computer?” He said, “Well, because it’s there and one day you’ll do the same for somebody else.”